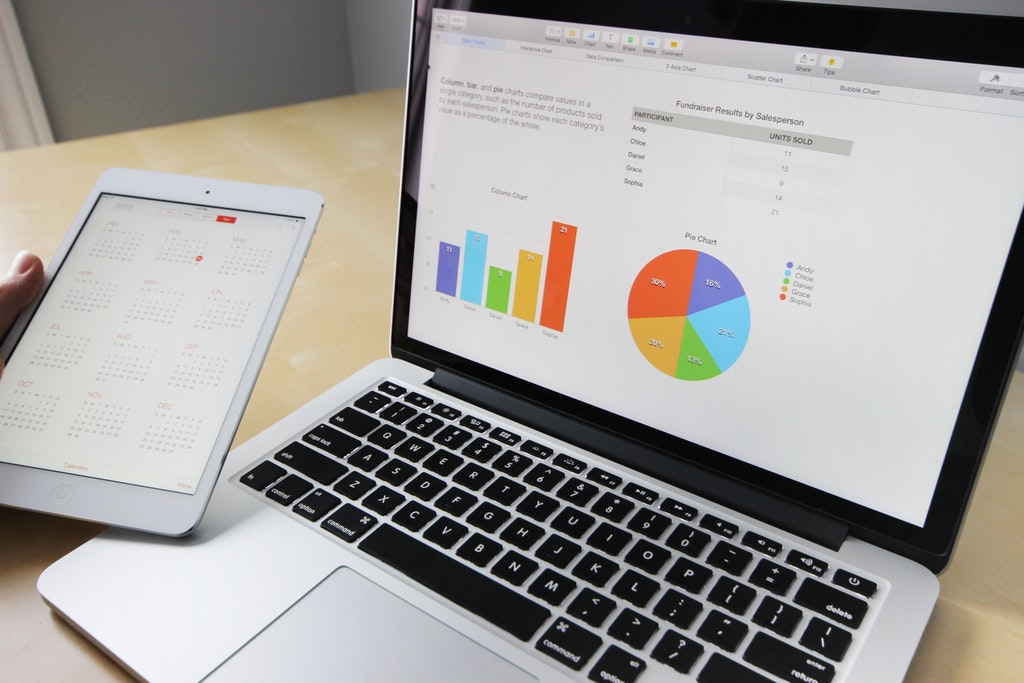
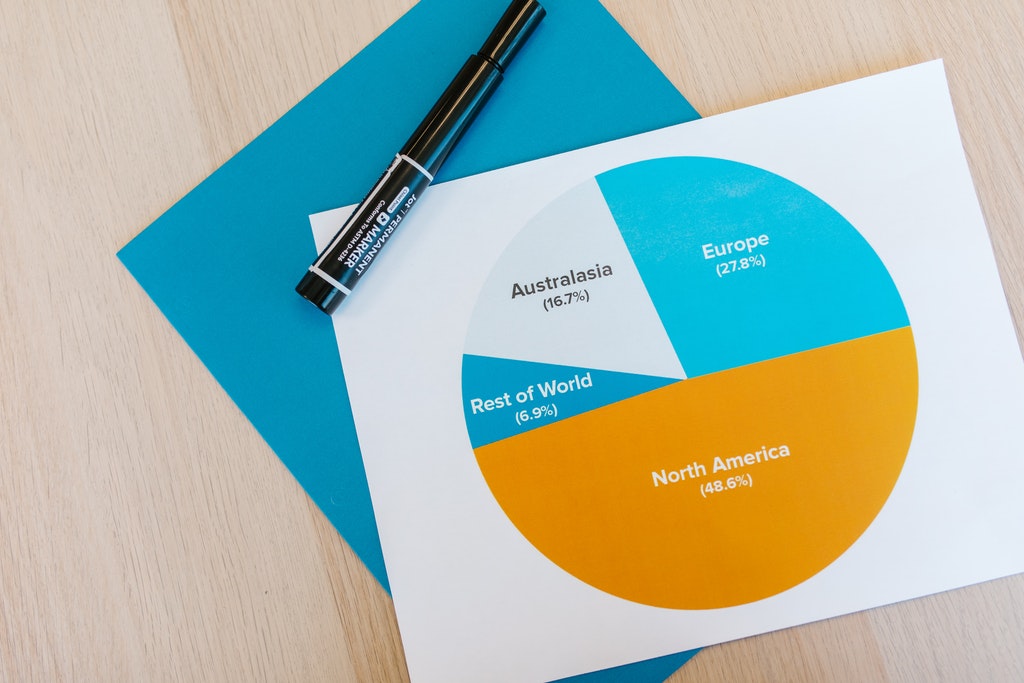
Pie charts are a core data visualization product that many people rely on daily. Building insights about business development, product rollout success, investment portfolio management, and even consumer budgeting or time management processes rely on this type of data product.
The pie chart is a truly versatile option for anyone looking to make sense of their daily life or business operations. Continue reading to learn more about the power of pie charts.
For those who might ask themselves, “What is a pie chart?” the answer is quite simple. Pie charts offer data users a glimpse into percentages of the total representative value of whatever you are analyzing. For budgeters, pie charts provide slices of the whole dollar amount you have to work with.
A pie chart might help demonstrate the portfolio diversification of your total investment holdings in other applications. The value of this type of data representation can’t be overstated. Used in tandem with different types of data visualization aids like a line chart, bar graph, and others, the data comparison is easy. It can give you a greater understanding of the total picture with ease.
Pie Charts Work in Percentages

Perhaps the unique thing about a pie chart is the fact that it offers up a visualization of percentages and proportions rather than aggregate numbers. A line chart or bar graph will provide you with a visualization of the total number of any given thing.
For instance, in a portfolio diversity study, a bar graph will show you the total dollar value or the number of shares you own of each company or ETF investment. This can be a valuable asset, as it can give you a side-by-side comparison of the investment stake that you’ve made in any company in terms of total dollars.
Likewise, line graphs offer the variable of time. These same data points (your stock portfolio holdings) might be represented with a line graph when seeking to understand the ongoing progression of the price action that each company has enjoyed over the last week, month, or year.
With a line graph, you can develop a sense of the ongoing patterns within the market and make changes to your holdings in accordance with your analysis.
A breakdown of the percentages of each asset held in the account is a crucial component of investor or saver success over the long term. Likewise, with additional functionality from budgeting to threat analysis, these data exploration tools are a must for anyone. On the other hand, a pie chart is the most crucial tool for effectively making these changes.
Every type of investor, from retail traders to large corporate entities that rely on algorithmic trading implementations to conduct their investments, uses a percentage-based approach to understanding the rebalancing needs of their portfolio at any one time.

Maintaining parity among high-risk investments and those poised for stable and slow growth over the long term is a core tenant of good investment advice. With the help of a pie chart, you can maintain balance throughout your trading career, no matter how many times you decide to sell shares of an asset that has reached a temporary price ceiling (according to your research and instincts, of course).
Pie Charts Are Simple to Create
With the help of Excel, or any other data visualization software that you opt to use in your personal life, building these comparison charts is easy. Utilizing the chart-making tools will allow you to select existing data points. The resulting pie chart will provide you with a graph representing the proportional balance of assets about the whole.
Likewise, for a handmade version, summing the values and then dividing for each individual asset will provide you with percentages that can then be plugged into the drawing phase of the chart-making endeavor.
Use a pie chart for a consistent understanding of your overall data proportionality.
