
Year-over-year growth is one of the most widely used performance measures in business, finance, marketing, and operations. It compares a metric from one period with the same period in the previous year, helping organizations understand whether performance is improving, declining, or staying flat. Because it accounts for annual cycles and seasonal patterns, YoY growth often provides a clearer view than month-to-month comparisons.
TLDR: Year-over-year growth measures the percentage change between a current period and the same period one year earlier. The formula is: ((Current Period Value – Previous Year Value) / Previous Year Value) × 100. Businesses use YoY growth to evaluate revenue, profit, customer acquisition, website traffic, expenses, and other key metrics. It is especially useful because it reduces the misleading effects of seasonality.
What Is Year-over-Year Growth?
Year-over-year growth, often abbreviated as YoY growth, is a comparison method that shows how much a business metric has changed over a 12-month period. Instead of comparing one month to the month immediately before it, YoY compares a period with the same period in the previous year. For example, January 2026 revenue would be compared with January 2025 revenue.
This approach is valuable because many businesses experience predictable seasonal changes. A retailer may see higher sales in December, while a travel company may perform best during summer. Comparing December with November may show strong growth, but that does not always indicate long-term improvement. Comparing December with the previous December gives a more accurate performance picture.
Year-over-Year Growth Formula
The standard YoY growth formula is:
YoY Growth = ((Current Period Value – Previous Year Value) / Previous Year Value) × 100
Each part of the formula has a specific purpose:
- Current Period Value: The value from the current month, quarter, or year being analyzed.
- Previous Year Value: The value from the same period one year earlier.
- Difference: The increase or decrease between the two periods.
- Percentage Result: The final YoY growth rate, expressed as a percentage.
If the result is positive, the metric increased compared with the prior year. If the result is negative, the metric declined. A result of zero means the metric remained unchanged.
Simple YoY Growth Example
Suppose a company generated $500,000 in revenue in Q2 of the current year. In Q2 of the previous year, it generated $400,000. The YoY calculation would be:
(($500,000 – $400,000) / $400,000) × 100 = 25%
This means the company’s revenue grew by 25% year over year. Analysts would generally interpret this as a strong improvement, especially if profit margins and customer retention also improved.
However, YoY growth should not be judged in isolation. A 25% revenue increase may be encouraging, but if expenses rose by 50%, profitability may have weakened. For this reason, many organizations track YoY growth across multiple performance indicators.
Examples of YoY Growth in Different Business Areas
YoY growth can be applied to many types of business data. Some common examples include:
- Revenue Growth: A business compares sales from this quarter with sales from the same quarter last year.
- Profit Growth: Finance teams examine whether net income has improved over the previous year.
- Customer Growth: Subscription companies measure how many more customers they have compared with the prior year.
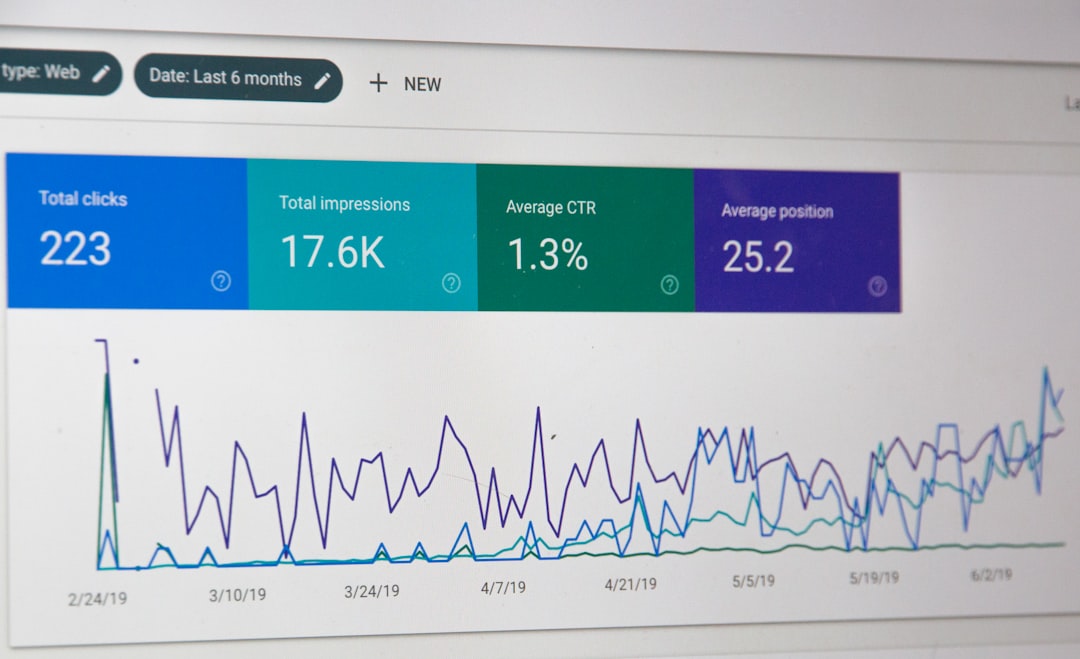
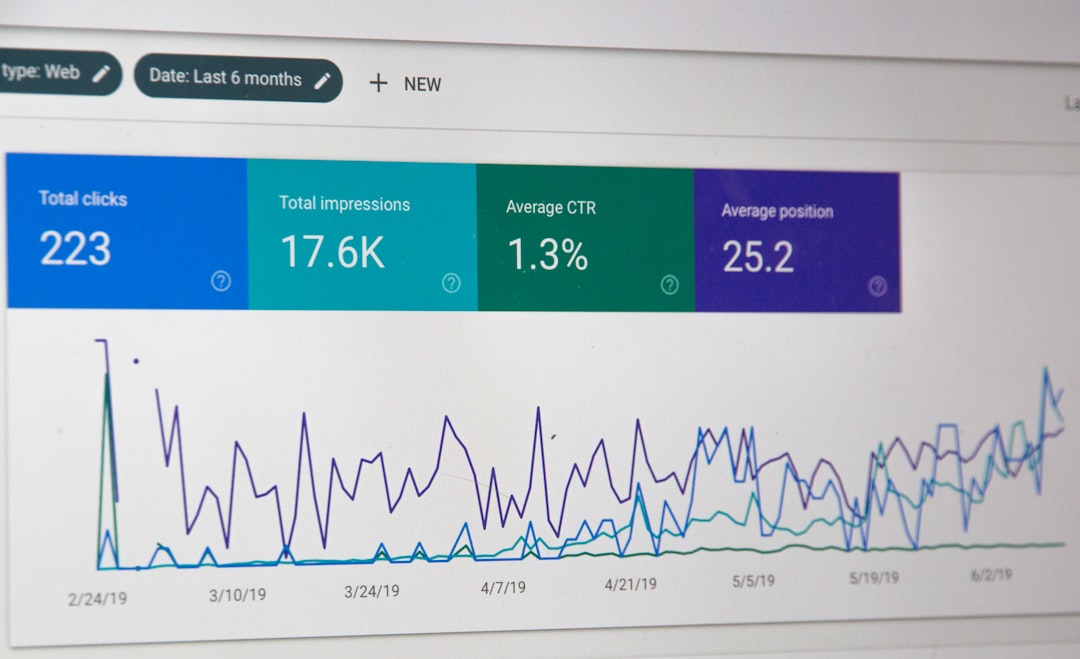
- Website Traffic Growth: Marketing teams compare visitors from the current month with the same month last year.
- Expense Growth: Operations teams review whether costs are increasing faster than revenue.
For instance, if an ecommerce store had 80,000 website visits in March this year and 60,000 visits in March last year, its YoY traffic growth would be:
((80,000 – 60,000) / 60,000) × 100 = 33.3%
This suggests that marketing, search visibility, brand awareness, or customer interest may have improved significantly.
Why Businesses Use YoY Growth
Businesses use YoY growth because it creates a consistent basis for comparison. Seasonal fluctuations, holidays, economic cycles, and marketing calendars can heavily influence short-term results. YoY analysis helps reduce the noise created by these temporary factors.
Some of the main advantages include:
- Seasonality Control: It compares similar periods, making results more meaningful for seasonal industries.
- Long-Term Trend Analysis: It helps leaders identify whether a company is improving over time.
- Investor Communication: Public companies frequently report YoY revenue and earnings growth to investors.
- Performance Benchmarking: Managers can compare different departments, products, or regions using the same metric.
- Strategic Planning: Executives use YoY trends to guide budgets, hiring, product launches, and market expansion.
Business Applications of YoY Growth
Financial reporting is one of the most common uses of YoY growth. Companies compare quarterly or annual revenue, gross profit, operating income, and net income to evaluate financial health. Investors often look for consistent YoY growth because it may indicate sustainable business momentum.
Marketing teams use YoY growth to assess campaign performance. A company may compare organic search traffic, paid advertising conversions, email revenue, or social media engagement with the same period last year. This makes it easier to determine whether marketing strategies are gaining traction.
Sales departments use YoY comparisons to measure pipeline growth, closed deals, average order value, and regional performance. If a sales team shows strong YoY growth in one region but flat results in another, leadership may investigate differences in staffing, pricing, customer demand, or competition.
Operations teams monitor YoY changes in expenses, production output, delivery times, and inventory turnover. Rising costs may not be a problem if revenue is growing faster. However, if expenses grow faster than sales, leadership may need to improve efficiency.
Human resources departments may also use YoY growth to track employee headcount, retention rates, training participation, or hiring costs. These insights help determine whether workforce planning supports overall business growth.
YoY Growth vs. Month-over-Month Growth
Although YoY growth is highly useful, it is not the only comparison method. Month-over-month growth, or MoM growth, compares a metric with the previous month. MoM analysis is helpful for identifying short-term changes, campaign effects, or sudden performance shifts.
For example, a software company may use MoM growth to monitor new signups after a product launch. However, it may use YoY growth to understand whether its overall customer base is expanding compared with the previous year.
In practice, businesses often use both. MoM growth reveals short-term movement, while YoY growth shows broader performance trends.
Limitations of YoY Growth
YoY growth is powerful, but it has limitations. A company may show strong YoY growth simply because the previous year was unusually weak. This is known as a low base effect. Similarly, a company may show weak YoY growth after an unusually strong prior year, even if current performance is healthy.
YoY growth can also hide recent problems. If a business grew strongly earlier in the year but performance has declined for the past three months, YoY results may still appear positive. For this reason, analysts usually combine YoY growth with other metrics, such as margins, cash flow, retention, and short-term trend data.

How to Interpret YoY Growth
Interpreting YoY growth requires context. A 5% growth rate may be excellent in a mature industry but weak in a fast-growing technology market. Similarly, a negative YoY rate may not always be alarming if a company is intentionally reducing unprofitable sales or exiting low-margin markets.
Good analysis considers:
- Industry benchmarks and competitor performance
- Profitability alongside revenue growth
- Economic conditions and market demand
- Company strategy, such as expansion or cost reduction
- One-time events that may distort comparisons
When used properly, YoY growth gives decision-makers a reliable way to evaluate progress and make more informed business decisions.
FAQ
What does YoY growth mean?
YoY growth means the percentage change in a metric compared with the same period one year earlier. It shows whether performance improved, declined, or stayed the same over a 12-month comparison.
What is the YoY growth formula?
The formula is ((Current Period Value – Previous Year Value) / Previous Year Value) × 100. The result is expressed as a percentage.
Why is YoY growth important?
YoY growth is important because it reduces the impact of seasonality and provides a clearer view of long-term performance. Businesses use it to analyze revenue, profit, customers, traffic, expenses, and other key metrics.
Is negative YoY growth always bad?
Negative YoY growth means the metric decreased compared with the previous year. It may be a warning sign, but it is not always bad. The cause, business strategy, and market conditions should be reviewed before making conclusions.
How is YoY growth different from MoM growth?
YoY growth compares a period with the same period in the previous year, while MoM growth compares a period with the previous month. YoY is better for long-term trends, while MoM is better for short-term changes.